Washington D.C. - Last week, The Digest covered newly released data from the National Science Foundation’s National Center for Science Education Statistics, which found that for the first time in five years, federal funding for higher education research and development increased in both current and constant dollars. For the country as a whole, higher education R&D expenditures increased by roughly 10 percent from FY 2011 to FY 2016, while gross domestic product increased by nearly twice as much. This article examines state-by-state trends in R&D activity at colleges at universities.
Overall, there were few changes among the top state performers of R&D at institutions of higher education (HERD), and those changes were relatively small. In a comparison of 2011 and 2016 rankings, 35 states moved just one spot or zero spots. Only one state, Connecticut, moved more than three spots in the rankings.
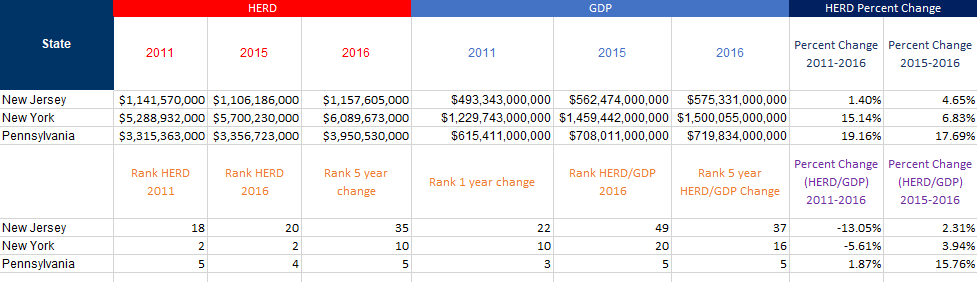
In FY 2016, California ($8.2 billion), New York ($5.3 billion), and Texas ($4.7 billion) led all states in R&D funding at colleges and universities. Those three states were also the top ranked states in 2011. The states with the least amount of R&D activity at colleges and universities in 2016 were Wyoming ($1.1 billion), South Dakota ($1.1 billion), and Maine ($1.0 billion) had the lowest levels of R&D at colleges and universities in FY 2016.
The states with the highest levels of R&D expenditures at colleges and universities in FY 2011 generally saw the largest overall, dollar amount increases over the following five-year period, as can be seen in the chart above. The top four states recorded increases of more than $595 million. For perspective, that amount is greater than the total HERD expenditures of 22 different states in FY 2016.
From FY 2011 to FY 2016, the states with the largest percentage increases in higher education R&D expenditures were Wyoming* (94.7 percent), Massachusetts (28.8 percent), and Connecticut (24.4 percent). Thirteen states saw their R&D totals decline from FY 2011 to FY 2016, with Maine (28.3 percent decrease), South Dakota (21.5 percent decrease), and Vermont (12.1 percent decrease) having the largest declines.
Three Midwestern states – Wisconsin, Illinois, and Ohio – stand out for having high R&D expenditures in FY 2011 but relatively little growth over that five-year period. Wisconsin and Illinois have faced highly publicized budgetary battles, with higher education funding at the front lines. On the other hand, Ohio reduced spending on higher education early in the five-year period and has been slow to recoup losses.
Although funding for higher education research and development increased from FY 2011 to FY 2016, it has largely failed to keep up with gross domestic product. For the country as a whole, higher education R&D expenditures increased by roughly 10 percent during that five-year period, while the sum of gross state products increased by nearly twice as much.
The map below shows states and higher education R&D expenditures as a share of each state’s gross domestic product (GSP). The proportion of HERD to GSP is a proxy for the importance that research at colleges and universities is to each state’s overall economy. HERD is especially concentrated in the Northeastern U.S. At 1.0 percent, Maryland had the highest share of HERD to GSP, followed by Rhode Island (0.8 percent) and Massachusetts (0.8 percent). These states had the highest shares in both 2011 and in 2015 as well.
From 2011 to 2016, only five states (Wyoming, Connecticut, Massachusetts, Alaska, and Pennsylvania) saw an increase in HERD expenditures as a share of their gross state product (GSP). In each of these states, the growth in R&D expenditures at colleges and universities outpaced the growth in GSP.
For the FY 2016 survey, it is worth noting that there were substantive changes made. These include changes to the field list, the classification structure of R&D, and the renaming of scientific fields, with some disciplines moved to different subfields. Furthermore, multiple universities changed the way that they report their R&D funding, which in some instances leads to large increases from FY 2015 to FY 2016.
*Wyoming’s significant increase in higher education R&D expenditures is a result of a methodology change by the University of Wyoming to identify funds that were not captured previously in other surveys.
The data used to inform this analysis is available for download in the excel file below.
Useful Stats 121417.xlsx